Using FLEXible to Record HTTP Communications
FLEXible is a tweak that can easily enable/disable the debugging tool FLEX in any application. The FLipboard EXplorer (FLEX) is a suite of in-app debugging and exploration tools for iOS that allows for the tester to view and interact with many aspects of the running application. One of its main advantages are the ability to record HTTP requests and responses.
Installation
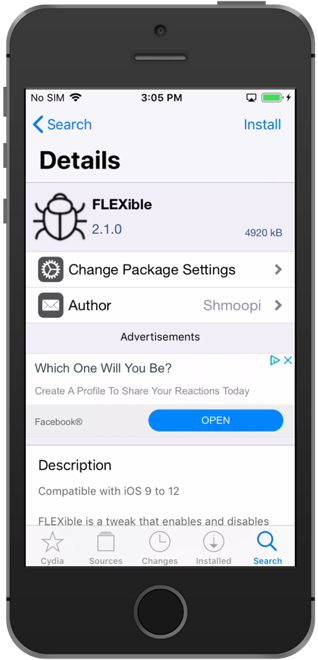
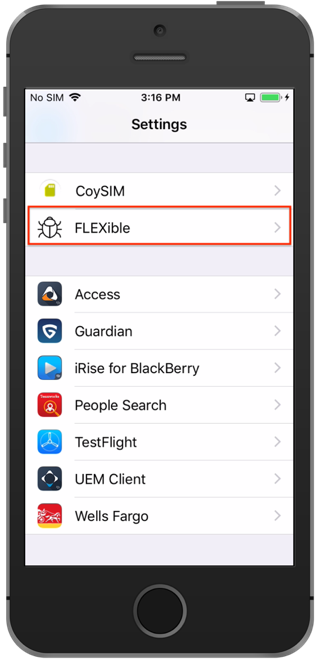
FLEXible is not associated with FLEX, but does include the FLEX debugger in its installation. So, installing FLEXible is simply a matter or searching and installing from Cydia or Sileo package managers. Once the tweak is installed, there will be an entry in the Settings app (near the bottom).
| Image1: FLEXible in Cydia: | Image2: FLEXible in Settings app: |
|---|---|
 |  |
Setup App to Debug
To enable FLEXible in the app that you want to test, follow these steps:
-
Ensure the app is fully closed (not just in the background). The debugger needs to be injected into the app, so if it is running it will not be injected as expected.
-
Open the Settings app and scroll down to the FLEXible entry.
-
Select "Enabled Applications" near the top, then enable the app that you wish to debug.
Using FLEXible
Once the app is enabled, close the Settings app and launch the target application you are testing. You will see a small floating toolbar appear over the app. You can move it up or down to an out of the way spot in your app by dragging the left side.
| Image3: FLEXible Toolbar |
|---|
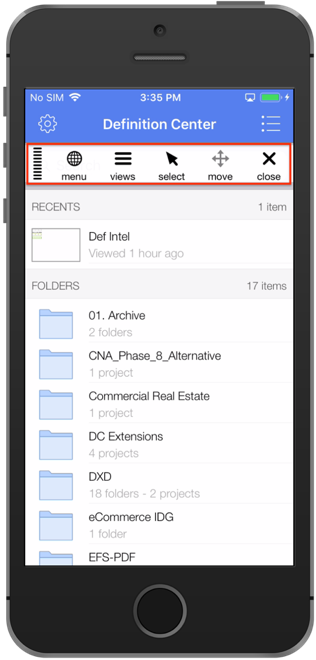 |
The main area that we will use is the "menu" tab. This is where we will setup the HTTP recording.
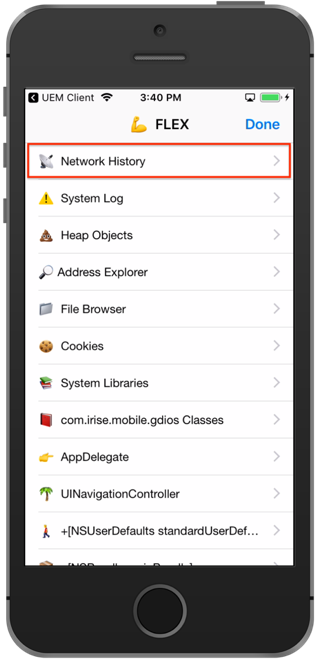
Tap the "menu" tab, then select "Network History". In the upper right, tap on "Settings". Toggle the "Network Debugging" switch so that it is enabled. Then tap on Done!
| Image4: Network History | Image5: Enable Network Debugging |
|---|---|
 | 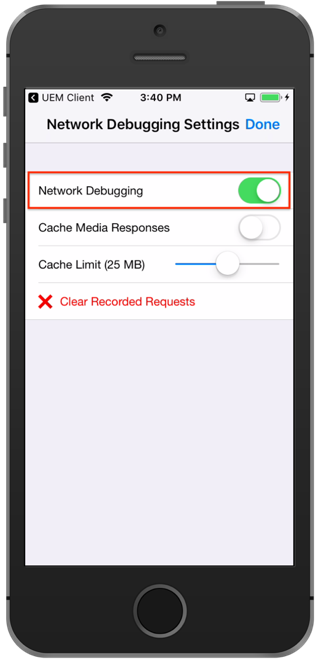 |
Once network debugging is enabled, logout out of your app, and completely close the app. This way, the Network History will be enabled from the start of the app. Once you log in to the app again, go back to the menu tab on the toolbar, and select Network History again. This time you will start seeing HTTP traffic, like image 6 below.
Additionally, if you select one of the entries you can see things such as the request method, response body, headers, etc.
| Image6: HTTP History | Image7: HTTP Request Data |
|---|---|
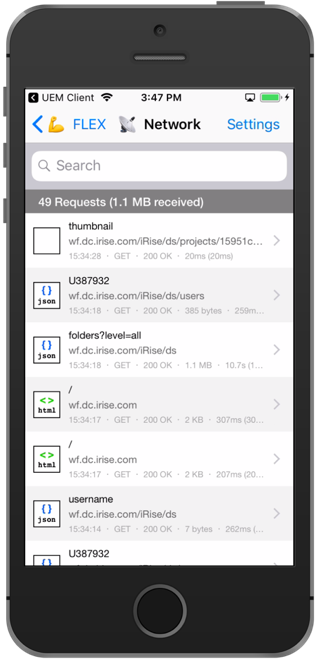 | 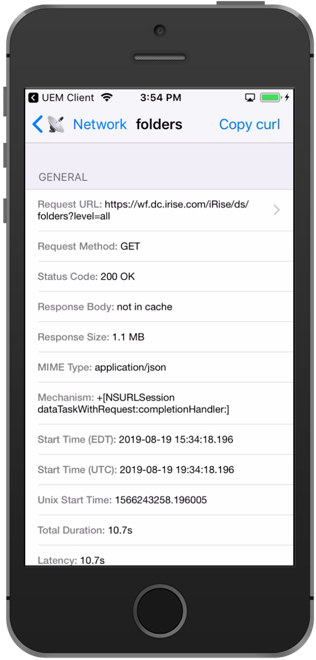 |
Additionally, there are other options in FLEXible that allows us to gain more insight into the applications' HTTP traffic, such as the Cookies that are set which has traditionally been out of sight due to Mobile Device Management (MDM) system policies.